

There is a persistent need for improved tools and techniques to facilitate public involvement in transportation decision making.
Have a case study?
Submit your project »
Case Study Narratives
Community Visualization of a Light Rail Transit-Oriented Developments
Creators: Dr. Ted Grossardt and Dr. Keiron Bailey*
Creator Affiliation: University of Kentucky Transportation Center
Client: Transit IDEA Program, TRB
Brief Description: The University of Kentucky with The Transit Authority of River City worked together to ascertain what design preferences the community had for a new light rail station and the two block radius surrounding it. The new light rail system is proposed to run from the downtown of Louisville, Kentucky to the Smoketown/Shelby Park area, a low income area.
Extended Description: Over the course of one year the University of Kentucky conducted public meetings with the residents of the Smoketown/Shelby Park area to establish design preferences for the proposed light rail station and the immediate two block area around it. The research team used the Casewise Visual Evaluation (CAVE) method to interpret the communities design preferences for the specific area. The CAVE method "uses a fuzzy set theory-based modeling system." (Grossardt & Bailey, 2004). Using generic visualizations the research team presents images to the community. Based on the community's response a preference model was established to move forward with the specific project.
The research team conducted three sets of meetings with the public during this time period. At the first meeting neighborhood concerns were discussed and visual images of other transit-oriented developments were shown. The discussion was facilitated by a keypad polling system.
At the second phase, meetings were held to identify specific design preferences. Generic images were presented on a projector screen and the polling results shown on another adjacent screen. The community was asked to vote on specific criteria such as building height, material, density, etc. The images were presented in two rounds, once with no discussion and once with comments taken about the image. The results found that after the discussion the images that were favored in the first round were even more after the discussion.
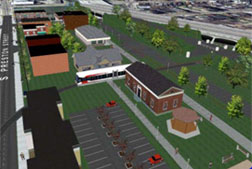
The team then went back with the polling information and analyzed the preferences of the community. They used the program Fuzzy Knowledge Builder to perform the analysis on the data. This allowed them to see what kind of results came from the combinations of design preferences established during the community meetings. From these results an architecture team put together three different visualization models to present to the community.
The final meeting included a similar process of using the keypad scoring system to evaluate the visual images developed by the architecture team presented on a screen. The results of the three images reinforced the previous results using generic images. The community was consistent in their design preference evaluation of the new visualization representing their neighborhood.
Time Frame: 10 months
Methods Used: Casewise Visual Evaluation (CAVE)
Tools Used:
-
Key Pad Polling
-
Photographs of existing Transit-Oriented Development
-
Virtual Reality Visualizations
Results: Using the CAVE the research team was able to quickly identify the community's preference for their design area. The chosen preferences were able to be analyzed to understand the most appropriate design based on the public opinion. This enabled the team to focus on a smaller group of options for the design presentation.
Challenge(s):
-
Fuzzy Knowledge Builder - Walker modeling engine, the software program, was hard to explain to participants who did not have technical education or professional background.
-
Gathering and typifying public input so as to pragmatically limit the number of possible designs to a manageable number.
Findings: Using the CAVE methodology accurately captures the public preferences using generic models, photographs or visualizations. This may be able to eliminate the need to confirm design approach with expensive VR visualization after establishing the public preferences.
View the Final Report Online:
http://www.trb.org/studies/idea/finalreports/transit/Transit33_Final_Report.pdf
References: Grossardt, T., & Bailey, K. (2004). Community Visualization of a Light Rail Transit-Oriented Development. Washington DC: IDEA Programs, Transportation Research Board.
*Dr. Keiron Bailey is now at University of Arizona