There is a persistent need for improved tools and techniques to facilitate public involvement in transportation decision making.
Have a case study?
Submit your project »
Case Study Narratives
Use of Visual Impact Assessment in Wellington, Ohio's Grade Separation Project
Creators: Planning and Policy Analysis Division
Creator Affiliation: John A. Volpe National Transportation Systems Center, Research and Innovative Technology administration, US Department of Transportation.
Client:
-
ODOT
-
Federal Highway Administration, US Department of Transportation, Office of Interstate and Border Planning, and Office of Project Development and Environmental Review
Brief Description: : An increase in the number of trains passing through Lorain County, Ohio has significantly increased on the CSX railroad tracks that carry large freight trains. Street crossings in this area where a grade-separation project was feasible were chosen. State Route 58 just north of the downtown of Wellington, a historic district was chosen. Visualization was used to present to the State Historic Preservation Office (SHPO).
Extended Description: CSX railroad traffic increased significantly due to consolidations within the railroad industry. Lorain County has been affected by these consolidations seeing increased traffic at railroad crossings. To help alleviate traffic ODOT engineers identified a number of locations that would be feasible to have a grade separation between automobile traffic and the train tracks.


Wellington's proposed site is located on State Route 58, just north of the historic downtown along Main Street. The proposal when first submitted did not include any visualization aides for the community or the SHPO(State Historic Preservation Office) to use. The project was found to adversely affect the historic area and therefore not allowed without an individual Section 4(f) evaluation. To avoid this process ODOT decided to present the project again to SHPO with visualization aids to help the members understand the visual impact of the grade separation change.
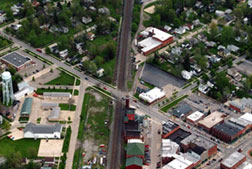
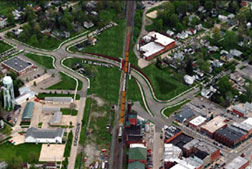
ODOT used a technique developed by the Minnesota DOT and FHWA, which is a six step process to identify visual impacts to a site. The steps include identifying affected visual resources; identifying affected people; defining existing visual quality; analyzing impacts to visual quality; summarizing visual impacts by alternative; and mitigating adverse visual impacts and enhance existing visual quality. These items were examined and results were presented to the SHPO by using before and after aerial photography and a 3-D animation.
After reviewing the visual impact statement and visualizations SHPO decided that the project did not adversely affect the historical site. They believed that the congestion and air pollution that exists without the grade separation would have worse affects than if the project was built. They were able to conclude to this decision because the intricacies of the project were made clear through the visualizations.
Time Frame: 3 months
Methods Used: Six-step method for quantifying the visual impacts of a proposed project, developed by the Minnesota DOT and the FHWA
Tools Used:
-
Aerial photographs from helicopter and ground photography
-
Bentley MicroStation/Geo Pak
-
Autodesk 3D Studio Max
-
Adobe Photoshop
Results: The use of aerial imaging and a 3-D driving simulation of the proposed project allowed members of the SHPO to understand the visual impact to the historic district.
Challenge(s): Deciding on investing in visualization to avoid a potentially lengthy appeal process with the SHPO
View the Final Report Online:
http://www.gis.fhwa.dot.gov/documents/visual_toc.htm
References: Planning and Policy Analysis Division, John A. volpe National Transportation Systems Center. (2009). Visualization Case Studies.


